1. Motivation
After stumbling on articles from HazyResearch and Luminal about , I had previously found myself in a similar position writing megakernels for cryptographic workloads rather than ML. The same fundamental tension applies: minimising kernel launch overhead while maximising memory bandwidth and SM concurrency to fully utilise the hardware. I wanted to understand how SOTA production LLM inference engine work on a lower level. I was curious about its scheduling, memory management, and kernel execution as these systems become the backbone of deployed AI products. SGLang was a good candidate to get started with as it is a production-ready inference engine and is well-documented.
This project started as a learning exercise: read the codebase, understand the design decisions, and build intuition for how a system like this manages the tension between latency, throughput, and memory. The natural next step was to profile it under realistic workloads, and once you start measuring, bottlenecks reveal themselves. This article documents that process: what SGLang does, where it slows down, and what can be done about it.
2. Approach
To keep the initial exploration tractable, I deliberately narrowed the setting to a single, well-defined configuration. All experiments run on a single Ampere A100 SXM4-40GB GPU with a Llama 3 8B model and a fixed batch size of 64. This makes it easier to attribute performance characteristics to the core inference engine.
The first step is to use SGLang's bench_one_batch utility, which
profiles a single static
batch end to end.
It instantiates a ModelRunner directly and runs prefill and decode separately, bypassing
the scheduler and any serving stack. This is ideal for understanding kernel timings and scheduling
behavior within one decode step, even though it does not reflect real-world serving dynamics such as
variable-length prompts, queuing, or adaptive batching.
2.1 Llama 3 8B
Performance-Critical Details
1. Grouped Query Attention (GQA)
8 KV heads shared across 32 query heads.
This reduces the per-token KV cache footprint by 4× compared to full MHA, which
directly shrinks memory bandwidth pressure during decoding — the dominant bottleneck in autoregressive
generation.
In SGLang, the RadixAttention layer (used instead of plain
nn.MultiheadAttention) exploits the smaller KV tensors for its prefix-sharing / radix-cache
mechanism.
2. SwiGLU via fused gate_up_proj
The two-stream FFN gate and up projections are merged into a single
MergedColumnParallelLinear, halving the number of GEMM kernel launches and
enabling the fused SiluAndMul activation kernel.
3. RMSNorm with fused residual
RMSNorm skips mean-centering (cheaper than LayerNorm). SGLang's RMSNorm
accepts an optional residual tensor and performs the add-norm in a single fused kernel,
avoiding an extra read/write of the hidden-state tensor between layers.
4. Large vocabulary (128 256 tokens)
The final lm_head linear projects from hidden dim 4096 → 128 256 logits. This is the
largest vocab in the Llama family and can become a softmax / logit-compute bottleneck
at small batch sizes. SGLang uses ParallelLMHead with
VocabParallelEmbedding to shard this across tensor-parallel ranks.
2.2 Profile GPU Kernel Execution
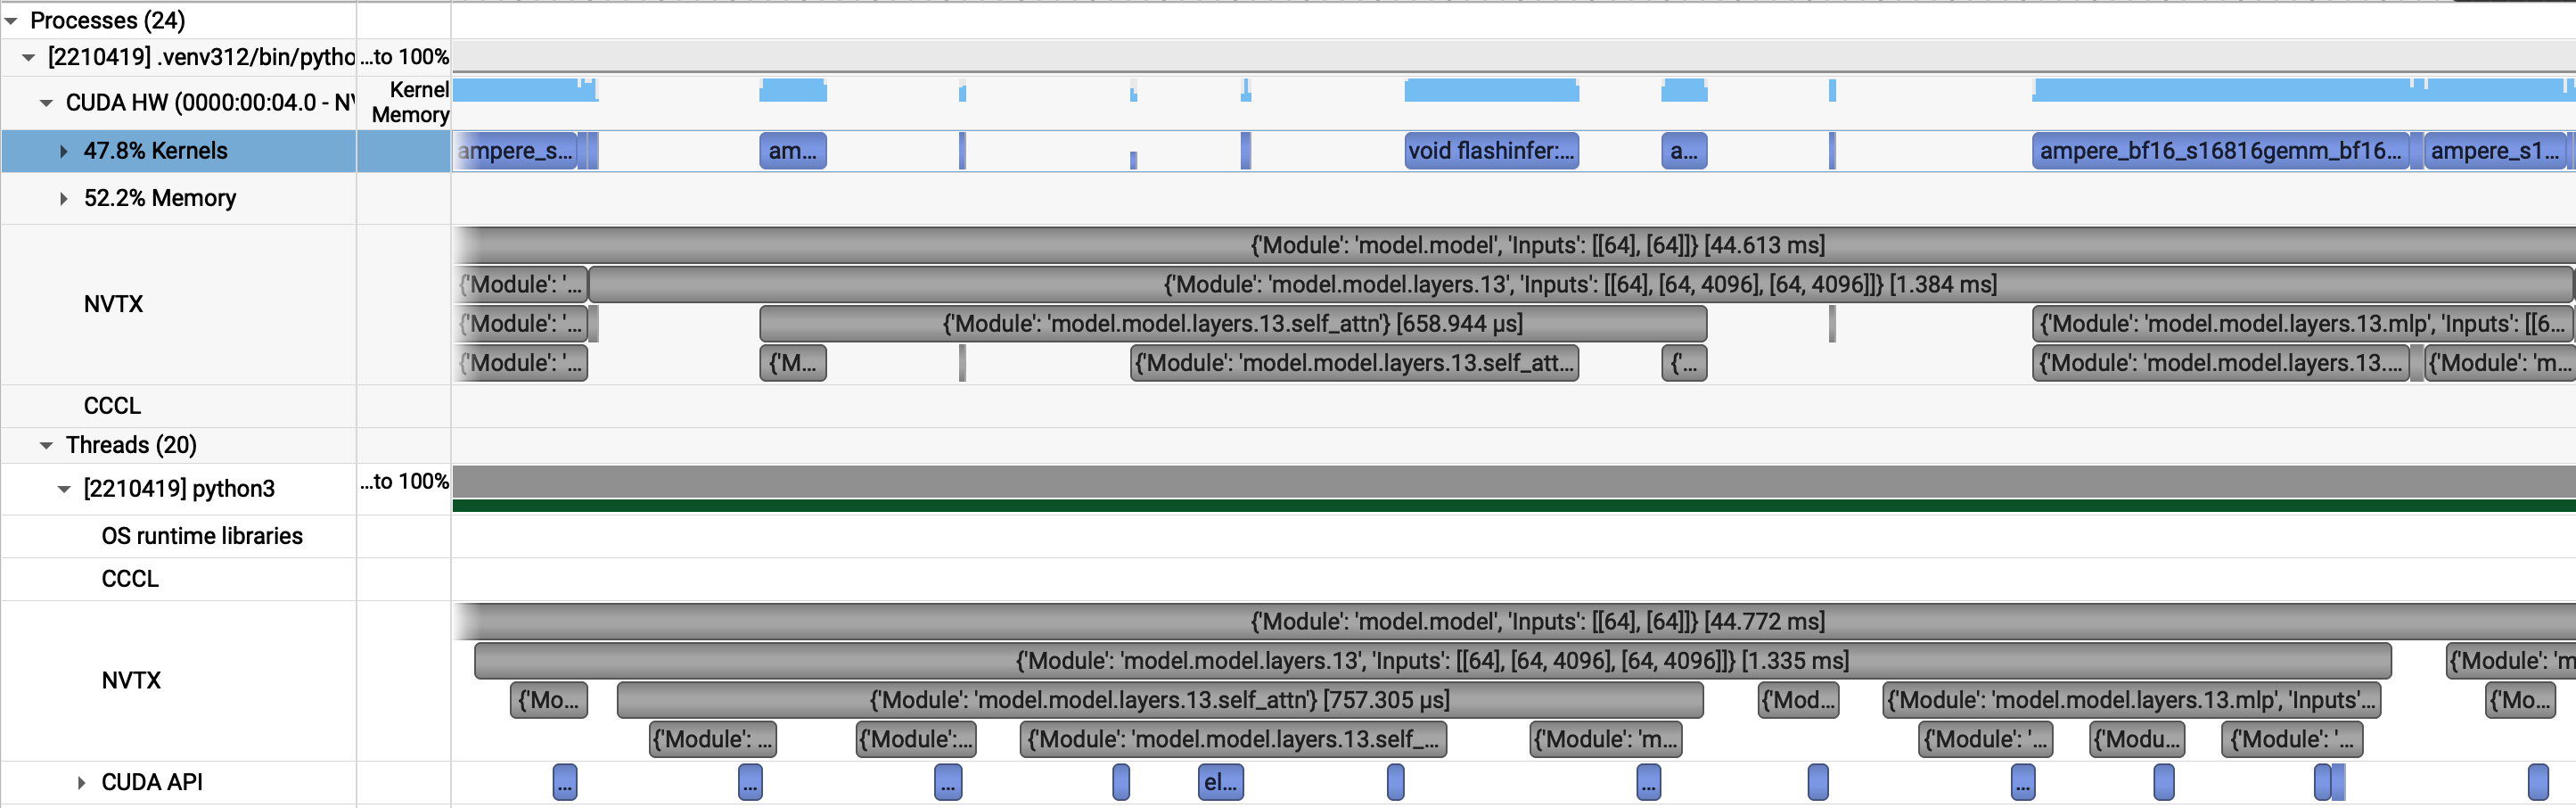
I always like to take a look at NSIGHT System first to get a high-level overview of the GPU and kernel usage. If we take a look at the profile, we clearly see that the kernels are far spread out over the timeline indicating that the GPU is not fully utilised. However, since we are profiling, CUDA graphs are disabled. We know now how what kernels a decode layer executes and can compare this with the graph-based execution to find out where the GPU is not fully utilised.
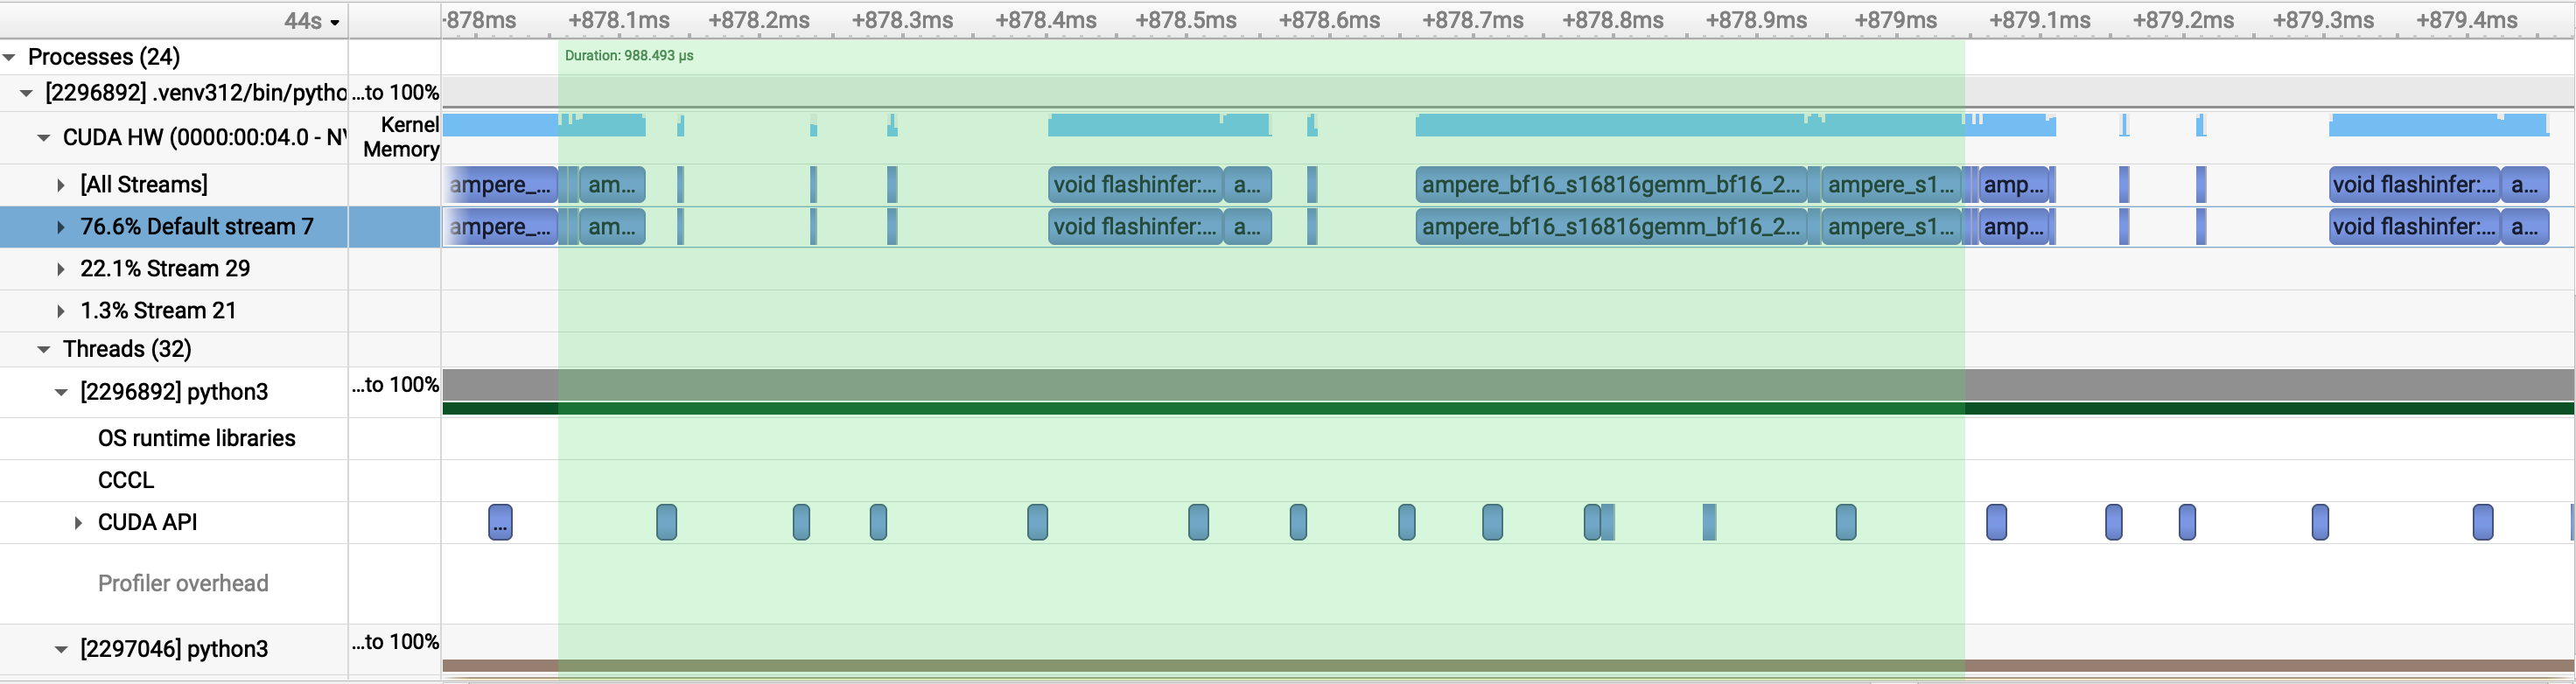
We can identify two sections with large gaps in the timeline even with CUDA graphs enabled.The first gap is attributed to a bottleneck in paged attention: One needs to compute the paged KV-cache index arrays that FlashInfer needs (indptr, last-page-len, slot indices). This computation is data-dependent: which pages are assigned to each request changes every step as sequences complete and new ones arrive. That dynamic Python computation happens on the CPU between the two (piecewise) graph replays. This is a fundamental bottleneck of paged attention, the index indirection is inherently dynamic. The second gap is a sublayer boundary in the piecewise graph execution. There is a segment boundary because the residual state needs to be routed through Python before the next segment starts and thus a FusedAddRMSNorm happens between two segments.
A Note on Cuda Graphs
A CUDA graph is a static recording of GPU operations which you capture once, then replay it with a single cudaGraphLaunch. Every input/output tensor address and kernel parameter must be fixed at capture time. Any dynamic value (computed at runtime from request data) breaks the capture. SGLang's decode step can't be captured as one graph because some operations require runtime CPU data (FlashInfer's KV page indices, which change as sequences arrive/finish). So instead it captures multiple small, piecewise graphs:
┌─────────────────────────────────┐
│  Segment 0 (one cudaGraphLaunch)│  ← pre-attention ops for all 32 layers
│  qkv_proj, split, rope, store   │    captured once, replayed each step
└────────────────┬────────────────┘
                 │  CPU: builds FlashInfer page-table arrays
                 │  (which sequences, which cache slots. Changes every step.)
┌────────────────▼────────────────┐
│  Segment 1 (one cudaGraphLaunch)│  ← attention
│  create_kv_indices, BatchPrefill│
└────────────────┬────────────────┘
                 │  CPU: routes residual state
┌────────────────▼────────────────┐
│  Segment 2 (one cudaGraphLaunch)│  ← post-attention + FFN
│  o_proj, norm, gate_up, silu,   │
│  down, norm                     │
└─────────────────────────────────┘
2.2 Torch Profile
The table below shows a representative slice of the Torch profiler output for a decode step with batch size 64, CUDA graphs disabled, and NVTX markers enabled. It lists the top operators by self CPU time and includes their corresponding CUDA time and call counts.
Profile trace output (expand)
-------------------------------------------------------  ------------  ------------  ------------  ------------  ------------  ------------  ------------  ------------  ------------  ------------
                                                   Name    Self CPU %      Self CPU   CPU total %     CPU total  CPU time avg     Self CUDA   Self CUDA %    CUDA total  CUDA time avg    # of Calls
-------------------------------------------------------  ------------  ------------  ------------  ------------  ------------  ------------  ------------  ------------  ------------  ------------
                                               aten::mm        21.42%       6.933ms        30.98%      10.027ms      77.731us      14.928ms        75.53%      14.928ms     115.723us           129
                                       cudaLaunchKernel        14.23%       4.606ms        14.23%       4.606ms      17.251us       0.000us         0.00%       0.000us       0.000us           267
                                Activity Buffer Request         8.39%       2.716ms         8.39%       2.716ms       2.716ms       2.593us         0.01%       2.593us       2.593us             1
                                    cudaLaunchKernelExC         7.59%       2.457ms         7.59%       2.457ms      19.048us       0.000us         0.00%       0.000us       0.000us           129
                             sglang::apply_rope_inplace         4.39%       1.420ms         6.52%       2.110ms      65.938us     104.960us         0.53%     104.960us       3.280us            32
                                            aten::empty         4.09%       1.323ms         4.09%       1.323ms      13.505us       0.000us         0.00%       0.000us       0.000us            98
                                             aten::view         3.61%       1.169ms         3.61%       1.169ms       3.619us       0.000us         0.00%       0.000us       0.000us           323
                                            aten::copy_         3.36%       1.087ms        13.93%       4.509ms     104.850us     196.484us         0.99%     199.077us       4.630us            43
                                    sglang::store_cache         3.34%       1.082ms         5.42%       1.755ms      54.829us      77.602us         0.39%      77.602us       2.425us            32
                                           aten::linear         2.86%     924.443us        41.39%      13.397ms     104.661us       0.000us         0.00%      14.156ms     110.591us           128
                                                aten::t         2.71%     878.034us         6.02%       1.948ms      15.217us       0.000us         0.00%       0.000us       0.000us           128
                                       aten::as_strided         2.55%     825.710us         2.55%     825.710us       2.244us       0.000us         0.00%       0.000us       0.000us           368
                          sgl_kernel::fused_add_rmsnorm         2.49%     805.753us         6.54%       2.117ms      33.071us     302.944us         1.53%     302.944us       4.734us            64
                                        aten::transpose         1.86%     602.505us         3.30%       1.070ms       8.357us       0.000us         0.00%       0.000us       0.000us           128
                                           aten::matmul         1.85%     599.146us        32.83%      10.626ms      82.376us       0.000us         0.00%      14.928ms     115.723us           129
                                   cudaFuncSetAttribute         1.35%     435.503us         1.35%     435.503us       4.490us       0.000us         0.00%       0.000us       0.000us            97
                                 aten::split_with_sizes         1.30%     421.881us         1.82%     588.099us      18.378us       0.000us         0.00%       0.000us       0.000us            32
          cudaOccupancyMaxActiveBlocksPerMultiprocessor         1.16%     375.015us         1.16%     375.015us       3.866us       0.000us         0.00%       0.000us       0.000us            97
                                  cudaDeviceSynchronize         1.10%     356.730us         1.10%     356.730us     178.365us       0.000us         0.00%       0.000us       0.000us             2
                                            aten::clone         0.98%     317.252us        16.18%       5.238ms     158.725us       0.000us         0.00%     143.493us       4.348us            33
                               sgl_kernel::silu_and_mul         0.98%     317.207us         2.84%     920.513us      28.766us     263.904us         1.34%     263.904us       8.247us            32
                                        aten::unsqueeze         0.97%     314.015us         1.32%     428.367us       6.693us       0.000us         0.00%       0.000us       0.000us            64
## Call CompiledFxGraph fc5debfulefezw7hs63rdl3utzgw...         0.97%     313.937us         1.19%     384.736us     384.736us       0.000us         0.00%       1.984us       1.984us             1
                             Torch-Compiled Region: 0/0         0.96%     310.291us         2.31%     749.333us     749.333us       0.000us         0.00%       1.984us       1.984us             1
                                        cudaMemcpyAsync         0.47%     151.082us         0.47%     151.082us      30.216us       0.000us         0.00%       0.000us       0.000us             5
                                       aten::empty_like         0.43%     140.446us         2.04%     659.754us      19.405us       0.000us         0.00%       0.000us       0.000us            34
                                               aten::gt         0.42%     135.124us         0.42%     135.124us       2.145us       0.000us         0.00%       0.000us       0.000us            63
                                           aten::select         0.40%     128.554us         0.55%     177.289us       2.728us       0.000us         0.00%       0.000us       0.000us            65
                                       aten::contiguous         0.40%     128.260us         7.83%       2.535ms      79.228us       0.000us         0.00%     138.307us       4.322us            32
                                             aten::item         0.24%      78.558us         0.35%     114.252us       1.785us       0.000us         0.00%       0.000us       0.000us            64
                                    aten::empty_strided         0.24%      76.449us         0.24%      76.449us       7.645us       0.000us         0.00%       0.000us       0.000us            10
                                           aten::cumsum         0.22%      70.404us         0.34%     108.893us      54.447us       4.288us         0.02%       4.288us       2.144us             2
                                       aten::is_nonzero         0.22%      69.836us         0.56%     181.533us       2.881us       0.000us         0.00%       0.000us       0.000us            63
                                           aten::unbind         0.20%      65.159us         0.70%     227.784us     227.784us       0.000us         0.00%       0.000us       0.000us             1
                                            aten::slice         0.19%      60.540us         0.24%      76.531us       8.503us       0.000us         0.00%       0.000us       0.000us             9
                               TorchDynamo Cache Lookup         0.18%      59.382us         0.18%      59.382us      59.382us       0.000us         0.00%       0.000us       0.000us             1
                                 cudaDeviceGetAttribute         0.15%      48.452us         0.15%      48.452us       1.346us       0.000us         0.00%       0.000us       0.000us            36
                                         aten::_to_copy         0.14%      46.283us         0.85%     276.426us      39.489us       0.000us         0.00%      53.536us       7.648us             7
                           triton_poi_fused_clamp_sub_0         0.14%      45.932us         0.22%      70.799us      70.799us       1.984us         0.01%       1.984us       1.984us             1
                                             aten::add_         0.14%      43.987us         0.20%      65.034us      21.678us       4.512us         0.02%       4.512us       1.504us             3
                                           aten::argmax         0.13%      41.340us         0.23%      73.254us      73.254us      63.904us         0.32%      63.904us      63.904us             1
                              aten::_local_scalar_dense         0.11%      35.694us         0.11%      35.694us       0.558us       0.000us         0.00%       0.000us       0.000us            64
                                     aten::index_select         0.10%      32.411us         0.36%     116.961us     116.961us       0.000us         0.00%       3.104us       3.104us             1
                                               aten::to         0.10%      31.122us         0.95%     307.548us      20.503us       0.000us         0.00%      53.536us       3.569us            15
Self CPU time total: 32.370ms
Self CUDA time total: 19.765ms
From this snapshot, GEMMs clearly dominate GPU time: aten::mm and aten::matmul
together account for 75.53% of self CUDA time (14.928 ms out of 19.765 ms). This is expected
in the decode regime: at batch 64 the per-step GEMMs have
A100 BF16 Tensor Core peak: 312 TFLOP/s; HBM2 bandwidth: 1,555 GB/s (1.56 TB/s) →
ridge point: 312 ÷ 1.555 ≈ 200 FLOP/byte. Any kernel below this ratio is memory-bandwidth-bound;
above it, compute-bound.
around 64 FLOP/byte, well below
the A100's ridge point of roughly 200 FLOP/byte, so these matmuls are firmly in the
memory-bandwidth-bound region.
GEMM shapes & arithmetic intensity, Llama 3, bs=64 (expand)
Weight shapes per layer:
QKVParallelLinear(hidden_size, head_dim, total_num_heads, total_num_kv_heads)
  → weight [4096, (32 + 8 + 8) · 128] = [4096, 6144]
RowParallelLinear(total_num_heads · head_dim, hidden_size)          (o_proj)
  → weight [4096, 4096]
MergedColumnParallelLinear(hidden_size, [intermediate_size] × 2)   (gate_up)
  → weight [4096, 2 · 14336] = [4096, 28672]
RowParallelLinear(intermediate_size, hidden_size)                  (down_proj)
  → weight [14336, 4096]
FLOPs & memory for activation
[M, K] × weight [K, N]:
FLOPs  = 2 · M · K · N
Memory ≈ 2 · (K·N + M·K) bytes BF16  — weight term dominates when M ≪ K, N
Concrete numbers for bs=64:
| GEMM | Shape [M,K]×[K,N] | FLOPs | Weights (BF16) | Activations | Arith. Intensity |
|---|---|---|---|---|---|
qkv_proj |
[64,4096]×[4096,6144] |
3.22 GF | 48.0 MB | 0.50 MB | 64.0 F/B |
o_proj |
[64,4096]×[4096,4096] |
2.15 GF | 32.0 MB | 0.50 MB | 64.0 F/B |
gate_up_proj |
[64,4096]×[4096,28672] |
15.03 GF | 224.0 MB | 0.50 MB | 65.1 F/B |
down_proj |
[64,14336]×[14336,4096] |
7.52 GF | 112.0 MB | 1.75 MB | 66.0 F/B |
| Layer total | 27.92 GF | 416 MB | ≈64 F/B | ||
| 32-layer model | ~893 GF | ~13 GB |
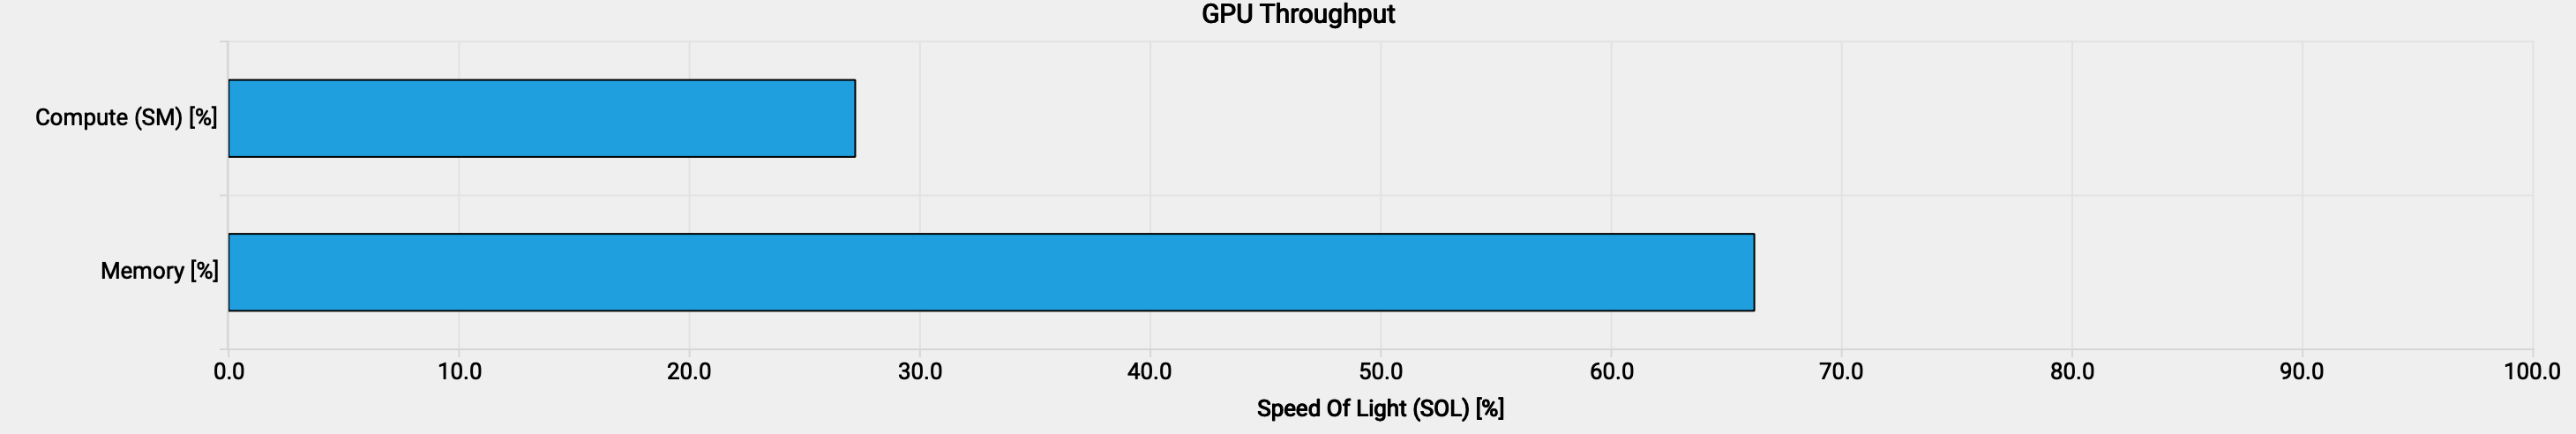
Nsight Compute confirms that the memory bandwidth throughput is much lower than the compute throughput. Memory throughput being still "only" 66% can be explained with the 3-stage matrix multiplication pipeline in the kernel (stages_64x3) that overlaps memory loads with tensor core math, so neither resource is fully stalled waiting for the other.
Two secondary effects stand out in the trace. First, RoPE positional encoding shows a roughly 13×
CPU-to-GPU time ratio: 1.420 ms of self CPU time versus 104.960 µs of self CUDA time across
32 calls (44 µs CPU vs 3.3 µs GPU per call). The GPU time is small because RoPE is a
lightweight elementwise op on a [64, 32, 128] tensor; any fixed dispatch cost dominates.
An AOT-compiled CUDA kernel would reduce this to a single cudaLaunchKernel call. Second,
the Q tensor passed to FlashInfer's decode wrapper is non-contiguous: it is a slice of a fused QKV
projection output. Because the wrapper requires a contiguous Q, it calls
q.contiguous(), which internally dispatches aten::clone to produce a copy.
Across 32 layers this shows up as roughly 281 µs per decode step from
aten::contiguous (138 µs CUDA total) plus aten::clone
(143 µs CUDA total).
3. Findings
Coming soon.
4. Optimizations
Coming soon.
5. Results
Coming soon.